Visualize real-time, video data to extract deep insights
Splunk Cloud captures, indexes, and correlates real-time data in a searchable repository from which it can generate graphs, reports, alerts, dashboards, and visualizations. When integrated with Datazoom’s real-time, video data infrastructure, the combination becomes a powerful pair for visualizing video streaming analytics.
In this article, we will review the process for setting up Splunk Cloud + Datazoom at a high level. Whether you’re an existing Splunk Cloud user interested in expanding your current use of the platform to include video analytics or a prospective Splunk user, it’s easy to get started – click here and sign up for a Datazoom account (complete with free access + 5 GB of data for your first 15 days). If you’re totally new to Splunk Cloud (and Datazoom) but also interested in seeing this combination in action, you can sign up for Splunk’s own 15 day-trial here. Both trials offer the full functionality of Datazoom and Splunk Cloud, respectively.
Before we get started…
Please review the following prerequisite steps necessary before you can visualize video data in Splunk Cloud. As always, our Help Center is a valuable resource for additional information along the way.
Prerequisite 1: It’s important to have created a Collector for your video player and have its configuration deployed before beginning.
Prerequisite 2: It is equally important to have created a Connector for Splunk Cloud and have it as part of your active Data Pipe with “timeSinceLastFluxData” and “Play Request” selected and enabled prior to proceeding.
Building Metrics
Splunk has its own query language to write the expressions which are used to calculate metrics. We’ll review four now.
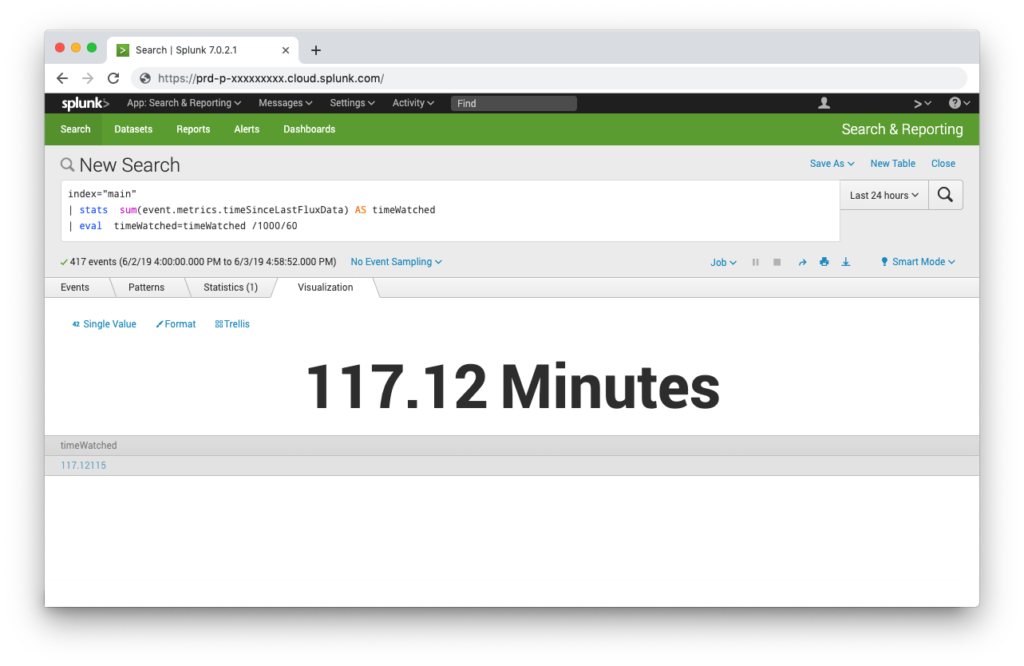
Creating a metric for the Number of Minutes Watched:
1) Login to your Splunk Cloud instance and navigate to Search.
2) Copy and paste the following into Search
index="<your configured index>"
| stats  sum(event.metrics.timeSinceLastFluxData) AS timeWatched
| eval  timeWatched=timeWatched /1000/60
3) Select the time period you’d like to search against in the right side of the “Search” tab found in the upper-left of the Splunk UI, then click the hourglass icon.
4) Select the Visualization tab from the results window and then format as necessary. We changed the result’s precision to two decimal places and added the unit “Minutes” after the result.
5) Select “Save As” under the “Search and Reporting” text in the upper right to save the search as a Dashboard Panel.
6) Select “New” then enter a name for your new dashboard next to “Dashboard Title” then click “Save.”
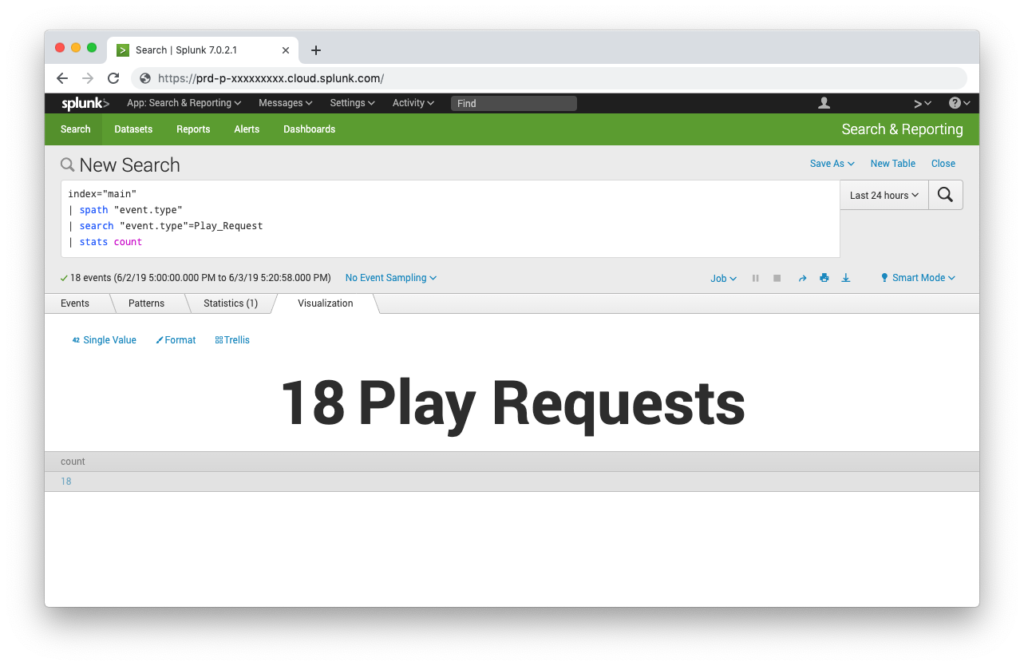
Creating a metrics for Number of Play Requests:
1) Copy and paste the following into Search:
index="<your index here>"
| spath "event.type"
| search "event.type"=Play_Request
| stats count
2) Select the time period you’d like to search against in the right side of Search then click the hourglass icon.
3) Select the Visualization tab from the results window. Format as necessary. We added the unit “Play Requests” after the result.
4) Select “Save As” under the “Search and Reporting” text in the upper right to save the search as a Dashboard Panel.
5) Select “Existing” then select the name of the dashboard you created previously.
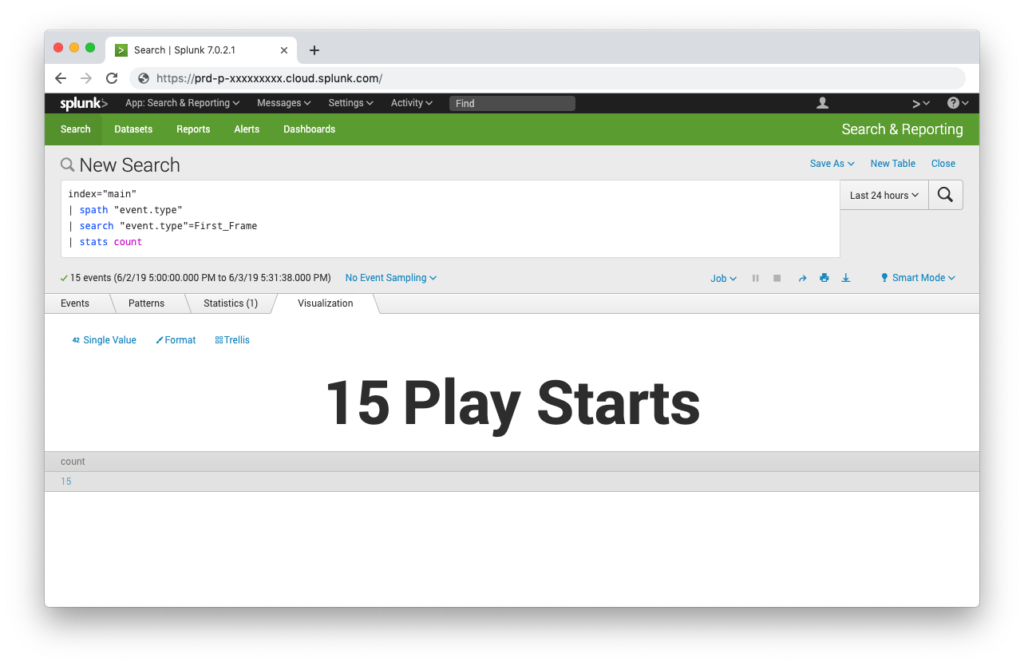
Creating a metric for the Number of Play Starts:
1) Copy and paste the following into Search:
index="<your configured index>"
| spath "event.type"
| search "event.type"=First_Frame
| stats count
2) Select the time period you’d like to search against in the right side of Search then click the hourglass icon.
3) Select the Visualization tab from the results window. Format as necessary. We added the unit “Play Starts” after the result.
4) Select “Save As” under the “Search and Reporting” text in the upper right to save the search as a Dashboard Panel.
5) Select “Existing” then select the name of the dashboard you created previously.
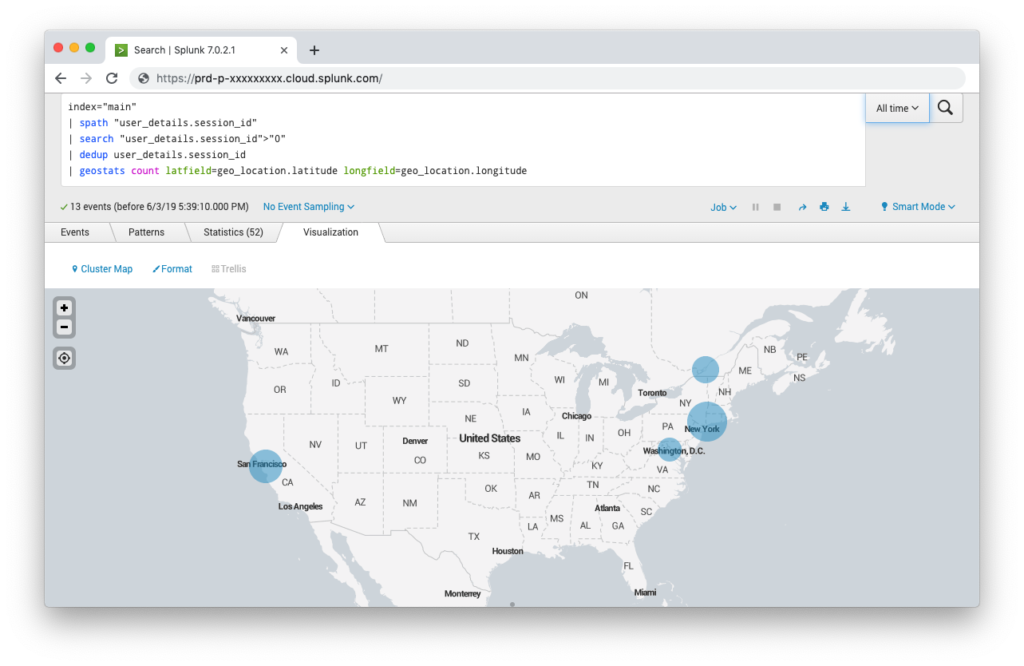
Creating a metric to visualize User Location(s):
1) Copy and paste the following into Search:
index="<your configured index>"
| spath "user_details.session_id"
| search "user_details.session_id">"0"
| dedup user_details.session_id
| geostats count latfield=geo_location.latitude  longfield=geo_location.longitude
2) Select the time period you’d like to search against in the right side of Search then click the hourglass icon.
3) Select the Visualization tab from the results window. Format as necessary.
4) Select “Save As” under the “Search and Reporting” text in the upper right to save the search as a Dashboard Panel.
5) Select “Existing” then select the name of the dashboard you created previously.
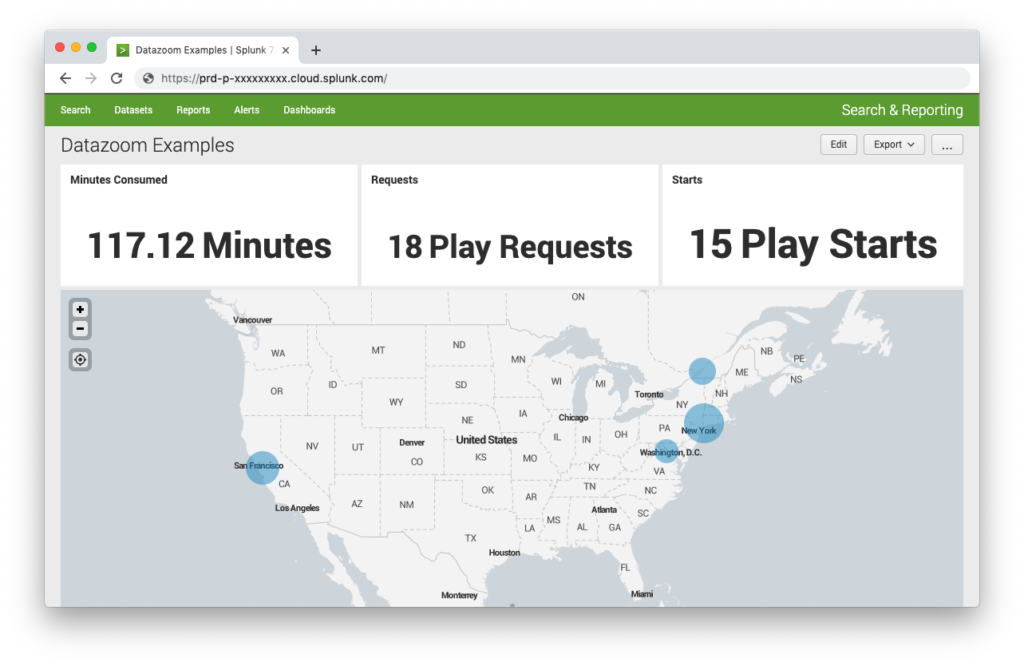
Editing the Dashboard
Once you’ve created and saved your searches, you can click on the Dashboard tab and navigate to the dashboard you created earlier. From here you can edit the dashboard further and adjust as necessary.
The Advantages of Custom Metric Design
Following these steps will yield a basic dashboard for tracking some simple video statistics. At Datazoom, we’re currently amassing a database of sample queries you can use as a starting point to building more sophisticated dashboards and reports.
Using customized queries such as Splunk’s, Datadog’s, and New Relic’s NRQL provides users with the ability to obtain more objective metrics tailored to their team’s specifications. Today, some of the nicest, most convivial video analytics vendors use unobjective formulas to compute metrics which do not align when compared against one another. While out of the box analytics packages are convenient, it is high time the industry pivot away from one-size-fits all approached to online video.
Using Datazoom + Splunk provides one way to base metrics in an objective, raw, data. Click here to see a demonstration of metric alignment across three APM tools integrated with Datazoom.
Happy Analyzing!