For those at the beginning of the journey to becoming data-driven, Google Analytics (GA) provides a solid foundation for familiarizing a team with an analytics platform. Traditionally used by e-commerce outlets looking to understand behavior on a website, GA provides real-time feeds, behavioral data, campaign performance tracking and conversion pipelines. Up to certain usage limits*, Google Analytics can be a powerful, cost-free and relatively easy to use tool for video analytics as well. When paired with Datazoom’s video data infrastructure platform, real-time, standardized video data can be routed from the player and into your dashboards. Here, we’ll lay out the five steps for getting started.
These metrics and pre-configured reports provide quicker access to new insights, resulting in, hopefully, fully optimized marketing campaigns driving more revenue.
Google Analytics offers two models (You can check them side by side here)
- Standard – *no charge up to 500,000 sessions and 20 custom dimensions. More information here.
- Premium “360” – additional charge
Before we proceed, it’s important that you have a Google Analytics account with tracking script configured on one or more webpages. For help, check out the Google Analytics Academy or this documentation here.
1) Set-Up a Google Analytics connector in Datazoom
First, go to app.datazoom.io and either sign-in or create a free Datazoom trial account. Then build your Connector according to this Tutorial or by following the basic steps we lay out here (at our Help Center).
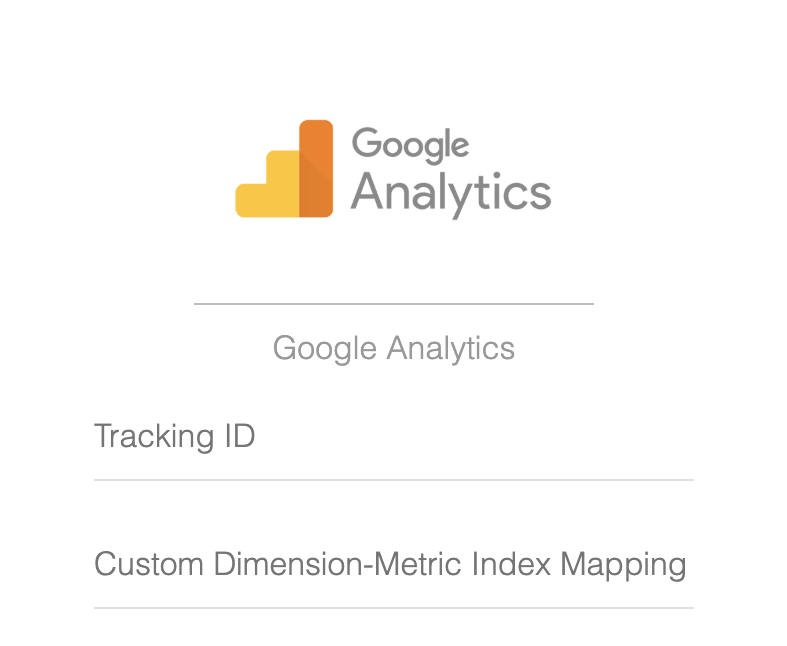
For Google Analytics specifically, you’ll require the Tracking ID associated with your account as well as the Custom Dimension-Metric Index Mapping configuration as detailed here.
2) Build Data Pipe
With Connector in hand, we can now link the Collectors associated with your video distribution components with Google Analytics with the help of a Data Pipe. For help setting one up, check out our tutorial videos.
3) Play Video
Soon after you start playing video, you’ll see real-time, raw video data being captured by Datazoom making its way into Google Analytics under the Realtime/Events section.

4) Basic Metrics.
Once you see data in the Real-time screen, you can begin to build visualizations and reports with the included tools under the “Customization” section of the main Google Analytics screen.

Some examples of the widgets illustrated above that you can build are illustrated below. These “bread-and-butter” widgets are useful starting points:
A. Sessions by Asset Title

B. Sessions by ASN Organization

C. Percent of New Sessions by streamingType

5) Improve metrics in Google Data Studio (next article).
While Google Analytics provides a springboard for getting started with analytics systems in general, it is, after all, designed for e-commerce and not video. In our next article, we’ll dive into how Google Data Studio can make the insights made possible by Google Analytics configured with Datazoom even more successful for managing your video content.
At this point, you’re ready to get started configuring useful widgets to power your video analytics strategy with Google Analytics. Pat yourself on the back once you come to your senses (maximizing the usability of a free tool for a task it wasn’t even intended for can be a little thrilling). Check out a real-world use case here!
But we’re not done yet.
In Part 2, we’ll enhance the usability of the metrics computed by Google Analytics by using Google Data Studio (another free tool) to build crisp, easy to use dashboards to make these metrics even more accessible.
There’s no time like the present to bring clarity to your video data strategies! Maximize the potential of Google Analytics for video when you get started by signing up for your free trial of Datazoom here.